Indicator 7: Institutional delivery rate
The institutional delivery rate is the proportion of expected live births that take place in health facilities.1
Numerator:No. women who give birth in facilities
Denominator:Expected live births
× 100Purpose
Understanding where women are giving birth is key to planning and monitoring obstetric and neonatal care strategies and services. This information essentially maps the “active patient”: decisions that women and families are making, or are being forced into making by circumstances, about the place where they give birth. It is important to know: How many women are giving birth in the health system, and in what types of health facilities (e.g., health centers, district hospitals) are those women giving birth? How many women are giving birth in government health facilities vs. private facilities? How many women are giving birth in facilities that perform all of the EmONC signal functions vs. in facilities that offer limited EmONC?
Data collection and calculation
The numerator is the number of women registered as having given birth in facilities (both government and private sector facilities). This includes all women who gave birth vaginally and all women who gave birth by cesarean section. It also includes women who gave birth to babies who were stillborn or who died after birth. The number of women who gave birth in government health facilities is most often found in routine HMIS systems. The number of women who gave birth in private sector facilities may need to be collected from other sources (although ideally, private sector facilities should also report service statistics to the national HMIS).
The denominator is an estimate2 of all the births expected in the area, regardless of where the birth takes place. It is calculated by multiplying the total population of the area by the most recent estimate of the crude birth rate of the same area, and dividing by 1,000. The crude birth rate measures the rate of live births, but for the purpose of this indicator it is used as an approximation of the rate of all births. In countries with strong civil registration and vital statistics systems, the actual number of births can be used in place of the estimation derived from the crude birth rate.
The indicator is typically expressed as a percentage (per 100 expected births).
Analysis and interpretation
There is no benchmark for this indicator; governments should set their own targets. The institutional delivery rate for a given time and area of interest can be compared to national targets or with other time periods to look at change over time.
It is important to note that there is often a challenge to get complete data from the private sector and thus the institutional delivery rate may be underestimated if women who gave birth in private healthcare facilities are not included in the numerator.
National institutional delivery rates can mask sub-national differences, where certain areas may be farther from reaching national targets. Calculating the institutional delivery rate for sub-national areas requires disaggregating the numerator and denominator by sub-national area. For the denominator (expected number of births in the sub-national area), the ideal is to have sub-national data for both population and crude birth rate. Sub-national crude birth rates are often unavailable, however, in which case the national crude birth rate can be used. Demographic and Health Surveys (DHS) also generally provide rural and urban crude birth rates, which countries may be able to use to help approximate sub-national variation.
The institutional delivery rate can be disaggregated by facility characteristics to provide more information about where women are giving birth. For example, disaggregating the numerator by level of facility (hospital vs. lower-level facility), by EmONC classification, or by elements of readiness (e.g., tracer item readiness scores and emergency referral readiness scores can help answer questions such as: Are the facilities where women are giving birth performing EmONC and functioning well? Or, are the majority of women giving birth in lower-level facilities that only offer a few of the EmONC signal functions?). This information can help planners determine which facilities need to be strengthened (e.g., facilities where many women give birth but that are missing some of the signal functions). It can also help flag low utilization in facilities that do perform EmONC (and spur further study about why women are not going there).
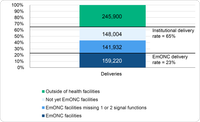
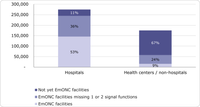
Figure 1 is an example of the distribution of expected births by EmONC classification. The dark blue bar is the number of women who gave birth in EmONC facilities (i.e., facilities that performed all of the Basic, Comprehensive or Intensive EmONC signal functions) or the “EmONC delivery rate” and the three blue bars combined represent the institutional delivery rate (65%). Figure 2 describes in which types of health facilities women are giving birth (hospital vs. non-hospital) and the distribution of those women according to the facilities’ EmONC classification. Once EmONC facilities have been designated and an implementation plan is in place, this indicator can also be used to monitor whether women are using the designated facilities that had specific program interventions.
Similar analyses could be done by disaggregating the numerator data by managing authority (i.e., private sector vs. government health facilities) to understand how much of the country’s childbirth services are being delivered in the private sector or the “private sector delivery rate.”
Interpretation of these results could be framed as indicators of women’s choices/preferences of where to give birth, and thus where health planners should target investment to align women’s choice with facility capacity. For context, it would be useful to look at this indicator alongside Indicator 6 on accessibility.
Figure 1: Distribution of expected births according to EmONC classification, in hypothetical country

Figure 2: Distribution of women giving birth in facilities according to EmONC classification, by type of facility in hypothetical country

Supplemental studies
Measuring equity
The institutional delivery rate can provide insight into equitable access to EmONC services if, for example, we analyze which groups of women are using facilities that perform EmONC and are well-functioning and compare them to groups of women using facilities that do not perform EmONC. It is then important to study whether there are substantial differences between these groups of women. Are there discrepancies in service use across groups that have historically been disadvantaged or discriminated against in the relevant context (e.g., are rural women who are poor and have not had formal education more likely to use poorly functioning facilities that are unable to perform EmONC)? Disaggregators could include client’s geographic region, urban/rural residence, age, socioeconomic status (education, literacy, household wealth, employment), marital status, and parity. More nuanced measures may include client’s spoken language, ethnicity, religion, ability, gender identity, and/or citizen/migrant status.
These measures require an examination of client-level data and a comparison of the characteristics of women giving birth at EmONC facilities (Basic/Comprehensive/Intensive) to those who are not.3 An option during EmONC assessments could be to include extraction of client-level data (using a supplemental client extraction form) at all sites, such that the client characteristics could then be compared between facilities classified as EmONC and those that are not. Alternatively, client data could be extracted from only those health facilities classified as EmONC facilities and then compared to representative household surveys recently completed that include the measures recommended above. For example, the DHS and MICS can serve as a population-level comparison as they include many of the equity measures recommended above. Another option would be to perform a multilevel analysis using population-based survey data together with health facility assessment data.
Understanding women’s choice
Calculating the bypassing4 ratio56 for a facility can tell you to what extent women in a facility’s catchment area are bypassing that facility to visit others. Calculating the bypassing ratio requires the following information:
- Number of deliveries in a facility that come from its catchment area of interest (= X)
- Number of deliveries in all other facilities which came from the catchment area of the health facility of interest (= Y)
The bypassing ratio is calculated as X/Y. A bypassing ratio of <1.0 would indicate that more women in the catchment area of interest bypassed care to another facility outside their area of residence than those women who sought care at their local facility. A ratio of >1.0 would show more women in the catchment area of interest sought care in the local facility than those who sought care at facilities outside the area.
Note that this indicator differs from the household survey-derived institutional delivery rate. This indicator uses administrative data from facility registers and the HMIS for the numerator (number of deliveries) whereas household surveys ask women where they delivered. The denominator for this indicator is the expected number of live births within a specified time period, whereas household surveys define the denominator as the number of live births in the last 3-5 years. The reason for these differences is that the EmONC Framework recommends analyzing the institutional delivery rate annually, which is more feasibly achieved by using facility data for the numerator and estimating the denominator than by conducting household surveys annually. ↩︎
When estimated population/birth numbers are imprecise, the results for the institutional delivery rate can become obviously unrealistic as more women seek facility services (e.g., resulting in institutional delivery rates >100%). Other indicators based on these imprecise population estimates are also skewed, but less obviously so. ↩︎
Pitchforth E, et al. Development of a proxy wealth index for women utilizing emergency obstetric care in Bangladesh. Health Policy and Planning. 2007; 22(5): 311-319. ↩︎
Bypassing of care is when an individual seeks care in a facility that is further from their residence while ignoring facilities closer to them that are permitted to and would offer the required service. (Michuki Maina, unpublished, 2022; Kruk ME et al, 2009) ↩︎
Michuki Maina presentation, available at ↩︎
Kruk ME, Mbaruku G, McCord CW, Moran M, Rockers PC, Galea S. Bypassing primary care facilities for childbirth: a population-based study in rural Tanzania. Health Policy Plan. 2009 Jul;24(4):279-88. doi: 10.1093/heapol/czp011. Epub 2009 Mar 20. PMID: 19304785. ↩︎