Indicator 6: Home to Comprehensive EmONC within 1 hour
This indicator measures the proportion of the population able to access at least a Comprehensive EmONC facility within 1 hour travel time.
Numerator:No. people in a specified area able to access at least a Comprehensive EmONC facility within 1 hour travel time
Denominator:Total population in specified area
× 100Purpose
Timely access to definitive, good-quality EmONC is necessary to accelerate further reductions in maternal and neonatal mortality. For women requiring emergency obstetric care, ‘timely’ access has been operationally defined for this indicator as within one hour of travel time to a facility able to provide Comprehensive EmONC.1 This threshold is based on an increased probability of a fatal outcome for women with obstetric complications and newborns born small and sick who require immediate care.23
Data collection and calculation
The numerator is the number of people in a specified area able to access at least a Comprehensive EmONC facility within 1 hour of travel time. The process for modeling what portion of the population has access to those facilities within a specified travel time is described in the Manual for the Measurement of the Ending Preventable Maternal Mortality (EPMM) Coverage Target #4.4
For planning purposes, in addition to modeling access within one hour, results should also be reported for access within two hours and within 30 minutes.
The denominator is the total population in the same area.
This indicator is typically expressed as a percentage.
The benchmark for this indicator is for 100% of the population to be able to physically access at least a Comprehensive EmONC facility within 1 hour.
If a country does not have the capacity to carry out GIS travel time modeling, users can instead look at the number of Comprehensive EmONC facilities in each sub-national administrative area in the country. This can be done by calculating Indicator 1a for CEmONC facilities for each sub-national administrative area.
Analysis and interpretation
If less than 100% of the population has access to a Comprehensive EmONC facility within 1 hour, then further investigation is needed to identify where gaps in geographic access exist. Disaggregation by sub-national geographical area may uncover areas that have poor access to EmONC facilities.
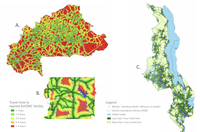
One of the results of an accessibility analysis such as the one conducted for this indicator is a map showing the spatial distribution of travel time to the nearest Comprehensive EmONC facility (and Basic and Intensive EmONC facility, if useful). It shows how long it takes to get to the nearest health service from each location in the region of interest, as shown in the example in Figure 1. Maps like these can help identify pockets of poor geographic access, so that strategies can be developed to improve access. Strategies might include focused implementation support for facilities in specific areas to help them become EmONC facilities, or improving road networks to increase the speed with which people can access facilities that are already functioning as EmONC facilities. (See Box 1 for strategies specific to rural and very remote areas.)
Figure 1: Examples of travel time maps in different places (A: Burkina Faso, B: center of Togo, C: Malawi)

Source: Manual for the Measurement of the Ending Preventable Maternal Mortality (EPMM) Coverage Target #4.5
In some contexts it may be useful to repeat the same GIS modeling exercise using only public EmONC facilities. This can provide further insights into the financial as well as geographic accessibility of EmONC services in a population.
It is also possible to interpret this indicator with other EmONC indicators, such as the institutional delivery rate, met need for emergency obstetric care, and the impact indicators.
Useful links
Further details on performing an accessibility analysis are explained in:
- 5.5.3. Analysis 1 - Accessibility - User manual (English) - Confluence [Internet]. [cited 2024 Jun 21].
Ebener S, Stenberg K, Brun M, Monet JP, Ray N, Sobel HL, Roos N, Gault P, Morrissey Conlon C, Bailey P, Moran AC, Ouedraogo L, Kitong JF, Ko E, Sanon D, Jega FM, Azogu O, Ouedraogo B, Osakwe C, Chimwemwe Chanza H, Steffen M, Ben Hamadi I, Tib H, Haj Asaad A, Tan Torres T. Proposing standardised geographical indicators of physical access to emergency obstetric and newborn care in low-income and middle-income countries. BMJ Glob Health. 2019 Jul 1;4(Suppl 5):e000778. doi: 10.1136/bmjgh-2018-000778. PMID: 31354979; PMCID: PMC6623986. ↩︎
WHO, UNICEF. Forthcoming norms for small and sick newborns. ↩︎
WHO, UNFPA. Forthcoming norms for maternal health. ↩︎
Under development. ↩︎
Under development. ↩︎
Uwamahoro NS, McRae D, Zibrowski E, Victor-Uadiale I, Gilmore B, Bergen N, Muhajarine N. Understanding maternity waiting home uptake and scale-up within low-income and middle-income countries: a programme theory from a realist review and synthesis. BMJ Glob Health. 2022 Sep;7(9):e009605. doi: 10.1136/bmjgh-2022-009605. PMID: 36180098; PMCID: PMC9528638. ↩︎
McRae DN, Bergen N, Portela AG, Muhajarine N. A systematic review and meta-analysis of the effectiveness of maternity waiting homes in low- and middle-income countries. Health Policy Plan. 2021 Aug 12;36(7):1215-1235. doi: 10.1093/heapol/czab010. PMID: 34179952. ↩︎
Ugwa E, Kabue M, Otolorin E, Yenokyan G, Oniyire A, Orji B, Okoli U, Enne J, Alobo G, Olisaekee G, Oluwatobi A, Oduenyi C, Aledare A, Onwe B, Ishola G. Simulation-based low-dose, high-frequency plus mobile mentoring versus traditional group-based trainings among health workers on day of birth care in Nigeria; a cluster randomized controlled trial. BMC Health Serv Res. 2020 Jun 26;20(1):586. doi: 10.1186/s12913-020-05450-9. PMID: 32590979; PMCID: PMC7318405. ↩︎